Two Dimensional One Pulse (TOP) processing...
TOP reconstruction protocol (only
available from dm2006 versions)
-
Download the TOP example files [Download]
and extract the zip file to a directory of you choice.
-
Load the "YAG 300 001 BL.1R" 1D file
[Menu/File/Open. The 1D files shows multiple spinning sidebands arising from
the satellite transitions of AlO6 and AlO4
contributions.
-
Load the default decomposition parameters
[Menu/Decomposition/Load Fit]. This decomposition file only contains a fit
of the <+/-3/2> spinning sidebands allowing an exact measurement of the
spinning rate (31244.29Hz).
-
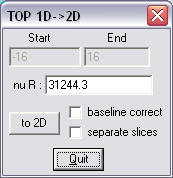
Generate the 2D TOP spectrum by calling
[Menu/Tools/TOP/1D->2D]
Click the "baseline correct" to add a baseline correction after the 1D->2D
conversion
Click the "separate slices" to separate the reconstructed spinning sideband
slices by nulls
Click the "to 2D" button to execute or "Quit" to exit
-
You should now have a 2D spectrum looking
like this (after rescaling with [Menu/Graph/Parameters change "level div" to
1.9].
In this spectrum you see
+ the AlO6 sharp line with its satellite
transition (right most intense line)
+ the AlO4 second order broadened central
transition, only showing up in the central slice (N=0) with its <+-3/2>
transition on the left side (sharp ridge) and even some contributions of the
<+-5/2> transitions.
-
Build the sum spectrum (equivalent to
synchronized acquisition) by calling [Menu/Tools/TOP/Proj all] and obtain the
spectrum below showing clearly the <1/2>, <3/2> and <5/2> transitions (from
right to left) of the AlO4 contribution
-
Go to the left panel button and select "ssb"
from the projection list ("no proj" by default) and build the projection
again [Menu/Tools/TOP/Proj N#0] and obtain the spectra of the satellite
transitions alone (by ignoring the N=0 central transition).